Science for Students: Newton's Law of Cooling

Science for Students: Newton's Law of Cooling
Delve a little deeper into the science of temperature changes! This investigation will provide data that will allow you to examine Newton"s Law of Cooling.For this investigation, you will need:
- One small container
- An insulator such as cotton, wool, cardboard, or newspaper
- Two thermometers
- Hot water
Now it's time to set up your investigation:
- Measure the thickness of your insulator and make sure it has a consistent thickness on all sides.
- Completely cover your container with the insulators you have chosen. Wrap all the sides evenly, and be sure to cover the top of the container with your insulator as well.
- Carefully make a hole the size of the thermometer in the top of your insulator cover. The hole can be made by poking a nail through the material. WARNING: Do not attempt to push a glass thermometer through the material to make the hole. The glass can break and cut your hand if you try to push it through.
- Fill your container with hot water.
- Insert the thermometer into your container.
- Use the other thermometer to measure the air temperature that surrounds your container.
Now you should have two thermometers: one measuring the temperature of the water in the container and one measuring the temperature of the air.
Start the investigation:
- Record the initial temperature measured by each thermometer.
- Continue to record the temperature of the water every 30 seconds for the next 10 minutes. You can let the experiment go longer if you wish.
- Over this time, the temperature of the air should remain fairly constant. If it begins to deviate by more than two degrees, pick a different location that has a more constant temperature and start your investigation again.
- Once the experiment is completed, create a plot of your data. Place the temperature of the water on the y-axis (vertical axis) of your graph, and the times on the x-axis (horizontal axis). Plot your data points using these axes.
When plotted, your data should produce a curved graph that shows how the water in the container cooled:
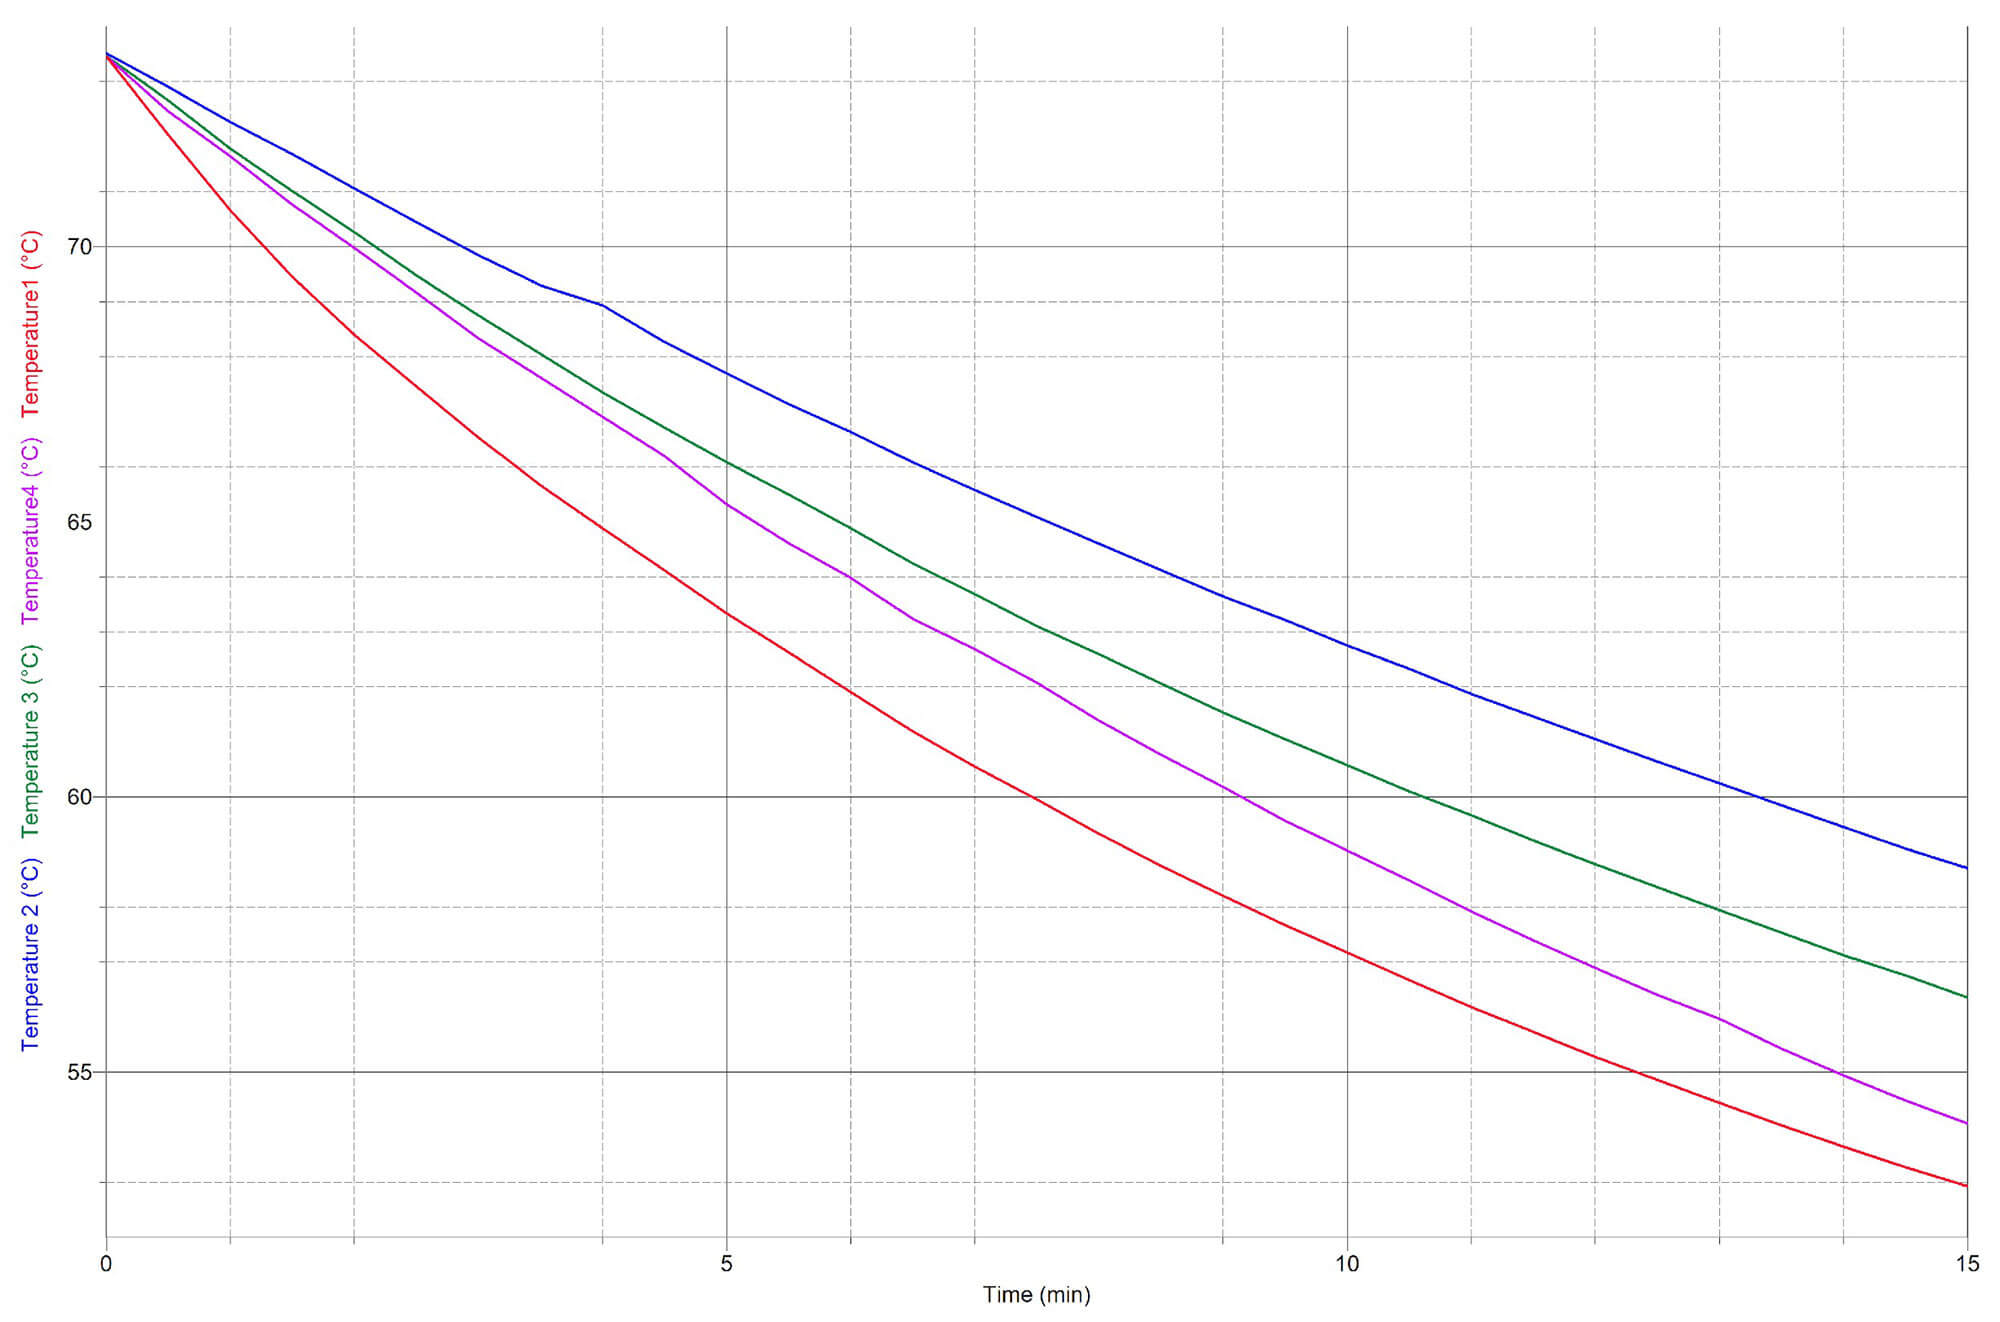
Run the investigation again using a different thickness of your insulator or a different type of insulation with the same thickness you used before. Plot your data on the same graph and observe how the new cooling curve differs from your previous cooling curve. Continue to repeat the investigation until you have enough cooling curves that allow you to draw a conclusion as to how the thickness or type of insulation affect the rate at which your water cools.
This is the third piece in a four-part Science for Students series. Read part one and part two, and check back next week for part four!
Mike Willard is a physics and environmental science teacher at Richard Montgomery High School in Rockville, MD. He is also involved in a number of engineering and environmental education outreach programs through the school. You can contact him at Michael_J_Willard@mcpsmd.org.